Saturday, August 29, 2020

Final Week - A recap of my GSoC experience

The Google Summer of Code program is ending on August 31, and as a final step I am required to write a report on all the work that I have done in the last three months. That's what I will do in this final blog post, while sharing some behind-the-scenes and some details that I may have missed in the previous posts.

The proposal

Gianluca Della Vedova contacted me back in February to discuss an interesting project idea from the OBF (Open Bioinformatics Foundation) called "The fastest GPU Variation Graph explorer (VG)". I was immediately drawn to the project, even though my parallel programming skills were admittedly limited. One of the project requirements was to use Rust, a programming language I had heard a lot about, but never actually used. 

So, after some help from Gianluca, I wrote a proposal, and sent it to my future mentors: Pjotr Prins, Erik Garrison and George Githinji. To be honest, I really did not think my proposal would get accept, but thankfully it was! A few weeks later, I met with Pjotr and the others in an online conference, and we started discussing what I would actually do during GSoC. 

Since I had little to no experience in Rust, we decided that re-implementing an already existing tool would be best, so that I would have some kind of reference. The tool we chose was Flavia95's GFAtoVCF, which while being relatively straightforward, would prove to be a great introduction to the world of Variation Graphs. And so, on June 1, I started working on my Rust re-implementation of GFAtoVCF, called rs-gfatovcf.

rs-gfatovcf (June - July)

My first contact with Rust was rather... rough. While it looks similar to C++, it feels like a completely different language, mostly due to the borrow checker. In order to start building some Rust knowledge, I started by mindlessly copying Flavia's script line-by-line, while also trying to make it more Rust-y in the process. While doing this, I noticed that there were multiple references to a library called Handlegraph, which I had never heard of before. At first I thought I had to re-implement that as well, but thankfully chfi had already done that with his rs-handlegraph. This library actually allows for storing Variation Graphs inside memory, and it is essential in a program that essentialy converts a GFA (that is, a Variation Graph) into a VCF.

Once I finished "translating" the code to Rust, I started working on how to actually improve it. First, I wrapped more parts of code into functions, so that they were easier to read; these functions were also splitted across multiple files, to further increase readability. Second, I replaced the DFS with a BFS, since I was getting inconsistent results when using a DFS. Third, I added a lot of tests, to make sure that everything worked correctly.

In the first two weeks of July, after some research on Rust concurrency, I started working on a concurrent version of rs-gfatovcf, mostly focused around the Rayon library. This however proved to be rather difficult, mostly due to how complex rs-gfatovcf is  (and to me being relatively inexperienced with Rust and parallelism). I plan on returning to work on parallelism once I have a greater understanding on how it works in Rust.

Even with the sequential version of rs-gfatovcf up and running, I noticed that in some instances, nested bubbles (also known as superbubbles) were not being correctly detected. Addressing this issue required a complete overhaul of the bubble detection process, and Erik suggested taking a look at a paper called Superbubbles, Ultrabubbles and Cacti by Benedict Paten et al. which contained a more refined approach for bubble detection.

rs-cactusgraph (August)

In the final section of that paper, the author stated that the approach was already implemented within vg, so I decided to take a look at vg's source code. I quickly found the related files, and initially decided to re-implement that in Rust as well. It didn't take long before I noticed that the implementation relied on another library called sonLib (or rather, pinchesAndCacti) which would have required too much time to re-implement. So I dropped the idea of a "translation" and instead decided to create my own implementation of the Superbubble detection algorithm, in a repository called rs-cactusgraph.

The first decision I had to make was which data structure to use. Handlegraph was the obvious choice, but I couldn't really get it work with the algorithm, so I decided to make my own implementation, backed by Petgraph. I therefore created a BiedgedGraph class and a way to convert a Handlegraph into a BiedgedGraph, so that I can run the algorithm on any graph from rs-gfatovcf.

When implementing the algorithm I tried to stay as close as possible to the original description in the paper. The hardest step to implement was the second one, that is merging all nodes in each 3-connected-component of the graph. Thankfully, chfi came to the rescue (again) with rs-3-edge, so all I had to do was to create an interface between his code and mine.

As of now, the whole algorithm has been implemented, but some more testing is definitely required. I also have to find a way to map the Cactus Graph back to the Handlegraph, in order to obtain the bubbles, which will be used in the variant identification phase of rs-gfatovcf.

Future work

The first thing that needs to be done is finishing up rs-cactusgraph, and making sure it works correctly. Once that is done, it needs to be integrated inside rs-gfatovcf which shouldn't take too long, and the resulting VCF should be validated against known tools such as vg deconstruct. This should obviously be repeated for as many graphs as possible, just to be as sure as possible that it works correctly.

Another interesting future project would be to complete the concurrent version, and actually start looking into parallelism. I really need to read more on these topics (both in general and with respect to Rust specifically), but once I do that I will definitely come back to this project.

Why this project matters

Due to its current international relavance, we are especially interested in finding variants (that is, a VCF file) from COVID-19 pangenomes, as part of the COVID-19 PubSeq Project. Maybe by looking at variants we will be able to understand how many different strains of the virus are currently circulating, or maybe we will be able to create ad-hoc treatments for each patient, according to how similar or different the virus samples extracted from him/her are to other known genomes.

TL;DR

  • rs-gfatovcf is a tool that finds variants in a Variation Graph. I worked on it in June and July, and with respect to the original implementation it is 100% done. You can find it at: https://github.com/HopedWall/rs-gfatovcf
  • rs-cactusgraph represents an attempt at improving rs-gfatovcf's bubble detection capabilities. I worked on it in August, and it's about 70% done. You can find it at: https://github.com/HopedWall/rs-cactusgraph
  • This tool will be used to analyze COVID-19 pangenomes, and by leveraging parallel computing we will be able to do so much faster.

Acknowledgments

I want to thank:
Also a big thank you to OBF and Google for allowing me to take part in this program!

Sunday, August 23, 2020

Week #12: Implementing the Biedged Graph to Cactus Graph conversion algorithm

This week was mostly spent implementing the Biedged Graph to Cactus Graph conversion algorithm presented in the paper by Benedict Paten et al. which should help improve the accuracy and correctness of my tool, rs-gfatovcf. This change was mostly due to two main reasons:

  1. The current Bubble Detection approach does not detect nested Bubbles (also called Superbubbles) correctly
  2. The resulting VCF cannot be used with popular tools (such as vg), meaning that the results may not be 100% accurate
Assuming that Variant Identification phase of rs-gfatovcf is actually correct, replacing the current Bubble Detection phase with the new algorithm should address both issues at the same time. I therefore created a new library, called rs-cactusgraph, that provides various utilities for Biedged and Cactus Graphs; once rs-cactusgraph is fully complete, it will be used as a support library for rs-gfatovcf.

As you may remember from last week's post, one of the main concerns was that Petgraph (the library used for storing the graph) would not scale well with larger graphs. While some more accurate testing has yet to be done, the kind of graph that I'm using (called GraphMap) uses a sparse adjacency matrix representation, with a space complexity of O(|V|+|E|), which I think isn't too bad. Another reason why I chose Petgraph over a HandleGraph implementation is that it provides more flexibility and ease of use. I'm still thinking about doing a Handlegraph implementation, but it will come at a later time.

The first step of the algorithm is to contract all the gray edges. This was relatively straightforward to do: since I store the gray edges in a vector, I just call the edge contraction procedure on each one of them. The only real problem here is to maintain consistency between the graph and the vector, but it can be avoided by carefully updating the edges when necessary.

The second step is to merge all nodes in each 3-edge-connected-component. Detecting these components is a really complex task, but thankfully chfi has already implemented it in rs-3-edge. There's only one problem though: rs-3-edge does not work with Biedged Graphs. So I created a way to convert a Biedged Graph into the appropriate format for rs-3-edge. I can now call rs-3-edge from inside my script, and after the 3-edge-connected-components have been found, I just merge all the nodes inside each component.

The third and final step is to merge all nodes in each cyclic component. By doing a DFS, loops can be found by checking for back edges (edges that connect a node to one of its ancestors in the visit). This step still needs a bit of work, but I think it can be done before GSoC ends.

Next week I will complete step 3 and do some final bugfixing. I will also write a final blog post recapping what has been done during this GSoC.

Sunday, August 16, 2020

Week #11: On Biedged Graphs and Cacti

As you may remember from last week's post, the algorithm presented in the paper by Benedict Paten et al. used a Biedged Graph, that is a graph with two types of edges (black and gray), such that each vertex is incident with at most one black edge. This is in contrast with Handlegraphs (as defined here) which, while sharing some similarities to Biedged Graphs, made it difficult to re-implement the algorithm in a straightforward manner. The main objective for this week was to find a way to implement the Cactus Graph creation algorithm Rust, while making sure that any change to the underlying data structure did preserve its correctness.

My first idea was to take a look at how vg implements the Handlegraph to Cactus Graph conversion. This is done in the cactus.cpp file, which I started re-implementing in Rust. However, soon after that, I noticed that some types referenced in that file were missing from the .hpp as well, with the include statements referencing a library called sonLib. I then found the github repo for sonLib, but there was no reference to Cacti either. Finally, I found PinchesAndCacti, which is the library the actually implements Cactus Graphs. Needless to say, I started re-implementing that as well, but after figuring that it would take too much time, I changed my mind. As a last attempt, I also tried using corrode, an automated C to Rust code translator, but after trying to use it unsuccesfully for a few hours, I gave up.

Since trying to replicate vg wasn't really working out well, I had to change my approach completely: I decided to create my own Cactus Graph Rust library, called rs-cactusgraph. The idea was to follow the paper step-by-step, while trying to create a general library for handling Cactus graphs in Rust. I decided to use Petgraph, a well-known Rust library for all kinds of graph, as a "back-end" for my implementation. 

Since the algorithm uses a Biedged Graph as a input, the first thing I had to do was creating a function to convert HandleGraphs into Biedged Graphs. This procedure is rather straightforward: 

  • each node (in the Handlegraph) is divided into two nodes; these two nodes are connected by a black edge
  • each edge (in the Handlegraph) is converted into a gray edge; since for each node in the Handlegraph there are now two nodes, it is necessary to decide which nodes to use (depending on which sides were connected to the edge).

A Handlegraph (above) and the equivalent Biedged Graph. The gray edges have been represented as red to make them easier to see.

My library features multiple multiple operations on Biedged Graphs, such as edge contraction (that will be used in the algorithm). It also allows for storing Biedged Graphs in Dot format, which can be converted in an image format by using tools such as graphviz.


A Biedged Graph created from a Handlegraph. Black edges are labelled with B, gray edges with G; the numbers represent the original NodeIds.

Next week I'll work on actually implementing the algorithm. There are also some concerns that Petgraph may not be the best library for larger graphs, so maybe Handlegraph could still be used instead as the "back-end" library for storing the graph.

Sunday, August 9, 2020

Week #10: Towards a new Bubble Detection algorithm

This week was mostly focused on studying the paper named Superbubbles, Ultrabubbles, and Cacti by Benedict Paten et. al (which can be found here) in order to improve the bubble detection capabilities of my script. As you may remember from last week, VCF validation didn't go as expected, and I think Bubble Detection may be (at least part of) what's causing the issue. So, I was suggested to use that paper as a reference for a new, more general, Bubble Detection algorithm.

The current approach, which is heavily inspired by Flavia95's work, albeit with a few changes (such as using a BFS instead of a DFS), has two main drawbacks:

  1. It is impossible to detect multiple (simple) bubbles that happen at the same distance from the root. This is due to the algorithm looking for a single node at a given level. This is clearly not the case when multiple bubbles are open at the same time.

  2. It does not detect superbubbles properly. While there is a simple way to detect when a bubble is opening, it's harder to tell when it must be closed.
An example of a problematic graph

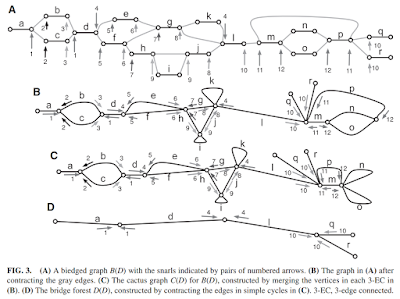
The approach presented in the paper is completely different. Instead of using a BFS-tree, it uses a completely different data structured called cactus graph. A cactus graph is a particular type of graph in which edge belongs to at most a single cycle (more information can be found here). The general idea is to convert the starting graph into a cactus graph, and then the cactus graph into a bridge forest.

In order to fully understand this paper, it is important to notice that the starting graph is represented as a biedged graph, that is a graph with two types of edges (black and gray), such as each vertex is incident with at most one black edge. With regards to the Handlegraph model, a black edge in a biedged graph is equivalent to a node; a grey edge is instead equivalent to an edge. While this conversion may appear to be straightforward, in practice is makes the algorithm not so easy to translate between the two.

In order to obtain the bridge forest from a given biedged graph, the following steps must be followed:
  1. Contract the grey edges in the biedged graph 
  2. Merge the vertices in each 3-edge-connected component, to obtain a cactus graph 
  3. Contract the edges in each cycle, to obtain a bridge forest 
Bridge forest construction algorithm illustrated


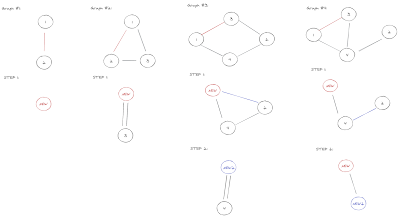
The main problem with applying this algorithm to a Handlegraph instead of a biedged graph is that in step 1 the grey edges get "eliminated" (or rather, contracted) so that only black edges remain. But what does this entail in a Handlegraph? It can't be multiple nodes because there is no edge (grey edge in the biedged graph) connecting them; it also makes no sense to have a single node representing the whole graph. This is still an open issue, and I'll try to solve it by taking a close look at how vg implements this algorithm.


My take on simulating step 1 of the algorithm above, but is it actually correct?

Saturday, August 1, 2020

Week #9: Refactoring rs-gfatovcf + VCF validation

As the second evaluation was getting close, all the mentors sent me their suggestions to improve my project last week. The #1 most reported problem was that the code was hard to read,  as all my project was basically contained in a single file, with over 1500 lines of code. I first decided to split it into three files: one containing the main function, one with all the I/O related functions, and another with all the remaining functions. Njagi then suggested to further split the functions.rs as into multiple files, and so I did. Now I have bubble_detections.rs and variant_identification.rs, which together with the readme.md should make it fairly straightforward to understand what each function actually does. Other smaller suggestions were implemented, such as adding logging to report errors, and adding more comments to make my code clearer.

This "improvement phase" also allowed me to add a few improvements I had been wanting to do for a while. One of these improvements was to find a better way to store Variants, which were previously represented in variant_identification.rs as a struct with 9 fields, all of them being Strings. This was wrong for two reasons:
  1. Position and Quality should be integers instead of Strings
  2. Some fields are optional as per the VCF format, but in my implementation they are all required
I fixed all of these issues in this commit. As you can see, multiple fields are now optional, and are correctly translated to a "." when written to a VCF file; also, Position and Quality are i32 now. A smaller work was also done on creating a Bubble structure in bubble_detection.rs. Now both files first present the data structure that will be used, and then all the related functions, which should make the code even easier to understand.

I then went back to VCF validation, which as you may remember from last week, didn't go as planned. The main idea was to compare the VCF returned by my tool to the one returned by vg deconstruct. Since this tool returns the VCF relative to a specific path, I had to add the ability to choose which reference path(s) should be used to detect variants. This can now be done via the -p (or --reference-paths), where a single path (or a list of paths separated by commas) can be specified.

By using the --reference-paths x,z option, only variants relative to paths x and z will be shown in the resulting VCF.

I then used bedtools jaccard to compare the VCFs from the COVID-19 pangenome, but unfortunately the result was quite low, meaning they don't really match. After more testing I discovered that nested bubbles (also known as superbubbles) are not detected correctly, and that may the reason the VCFs are so different. In order to solve this issue, the idea is to create a new bubble detection algorithm based on this paper, which will be able to detect superbubbles and also achieve greater accuracy overall.

Saturday, July 25, 2020

Week #8: More improvements to sequential rs-gfatovcf

As you may remember from last week's post, there were some segfaults which made it impossible to produce the VCF from the COVID-19 GFA; also, it took an excessive amount of time and memory on complex graphs. This week I actually managed to get it to work, but the results weren't what I expected.

Earlier in the week, I discovered what was causing the segfaults: when finding paths between any two given nodes (in the find_all_paths_between function),  I would store all the possible paths to a given node, for each node. This is a well known problem NP-hard problem, so finding a solution that is both fast and space-efficient probably isn't possible. 

I was then suggested to use a threshold, so that after a certain amount of edges have been traversed the procedure stops, and returns all the paths found up to that point. There is also a new option called --max-edges (or -m for short), that allows the user to choose which threshold to use, according to how powerful his/her computer is and how much memory it has. The default value is 100, and it allows for generating the COVID-19 VCF in a matter of minutes. Obviously the higher this value is, the more accurate the VCF.

After finally obtaining a VCF, we had to make sure it was actually correct (i.e. to validate it), but how can we do that? Erik suggested me to use vg construct, a tool that takes in a VCF and a reference genome in FASTA format and returns a GFA. The general idea is that if both GFAs match (or are at least very similar), then the VCF is correct.

So, in order to use vg construct I needed a VCF file (which I obviously had, as it's the output of my program) and a genome in FASTA format. Unfortunately there were no references to genomes in the GFA file, so I had to find a way to discover what reference genome had been used to generate it. Fortunately it's possible to extract the genome from the GFA via odgi build and odgi paths.

I was finally able to run vg construct and then... the VCF file and the reference genome did not match. That means there's some problems in how the algorithm works. As a first attempt, I changed how the VCF header is created in this commit, which should improve the quality of the result. I still have to investigate more on what could be causing this issue.


Sunday, July 19, 2020

Week #7: Going back to sequential rs-gfatovcf

The last week was dedicated to fixing a few scalability issues that my program was experiencing on larger and more complex GFA files. The main objective of this GSoC is to create a tool that is both general and well-performing, so I decided to go back to sequential rs-gfatovcf to fix the "general" part before continuing on with parallelization. Due to its current international relavance, we are especially interested in finding variants (that is, a VCF file) from COVID-19 pangenomes, as part of the COVID-19 PubSeq Project. Maybe by looking at variants we will be able to understand how many different strains of the virus are currently circulating, or maybe we will be able to create ad-hoc treatments for each patient, according to how similar or different the virus samples extracted from him are to other known genomes.

But what actually were these scalability issues I was talking about previously? Basically the only GFA I used to write tests was the one already included in Flavia's GFAtoVCF repository. While it's not a very simple graph, it obviously does not match the complexity of actual "real-world" graphs. For instance, this graph is about 1 kb, while the one from the PubSeq project is about 40 mb. That's about 40 000 times bigger! Also, "real-world" graphs can contain loops or nested bubbles, which makes bubble detection even harder. 

A small section of the graph that was used for the testing.
Noticed something yet? My script now supports JSON output for both the starting graph and its bfs-tree.

When I tried to use my script on the COVID-19 GFA something unexpected happened: Rust returned a stack overflow, which was caused by the BFS function. I was actually surprised at first, because I was quite sure the idea behind the function was correct. What I did not consider was that, when dealing with larger inputs, memory management plays an important role in how a program works (and also that ideas that work well in theory sometimes don't when used in pratice!). So I decided to rewrite BFS in the standard way, that is by using a Queue. A similar problem was found in find_all_paths_between, a function that finds all the paths between two nodes, and was solved in a similar way. Extensive testing was possible thanks to Erik's HLA-Zoo, a collection of GFA files useful for testing programs that use variation graphs.

Another issue found was that sometimes the script would return a segfault. Fixing the stack overflows appears to have solved most segfaults as well. Unfortunately I'm not yet able to extract the VCF from the COVID-19, mostly because the current method is very expensive in terms of memory usage, and after 1.5 hours+ of running I got a segfault. I hope that parallelization can help that significantly; I'm also curious of what would happen when running this program on a machine with more memory.